Microreact tutorial

Published

July 10, 2023

For Microreact documentation, go to https://docs.microreact.org/

Required internet browsers: Google Chrome or Mozilla Firefox

In this series of exercises, you will use Microreact to gain knowledge regarding a large collection of Klebsiella pneumoniae isolates, sampled from Colombia, between 2013 and 2019. At the end of this series of exercises, you will be able to identify a high risk clone circulating in the country.

Go to www.microreact.org/project/kpncolombia and explore the collection of isolates.

Task 1: Create an editable project.

Task 2: Present whole genome sequencing quality control (WGS QC) statistics in a chart. 

Task 3: What are the dominating sequence types (STs) in Colombia?

Task 4: Plot metadata blocks for the carbapenamase genes CTX-M-15, NDM-1, KPC and OXA. What are the prevalent AMR mechanisms detected ?

Task 5: Which STs are associated with the presence of carbapenamase genes?
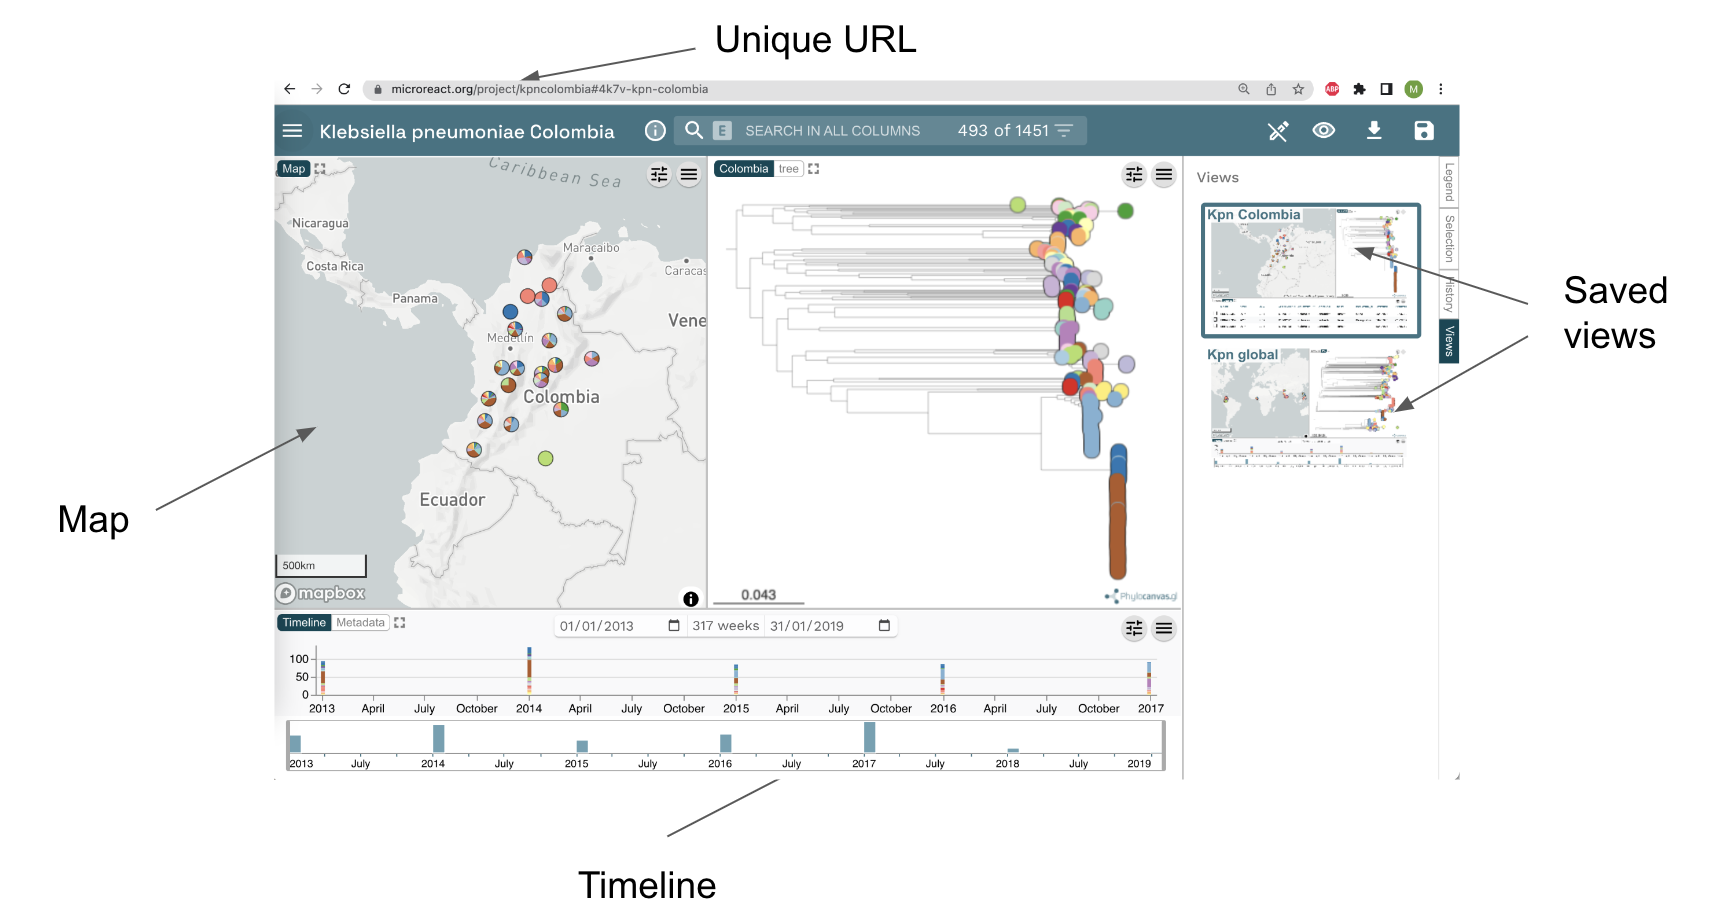
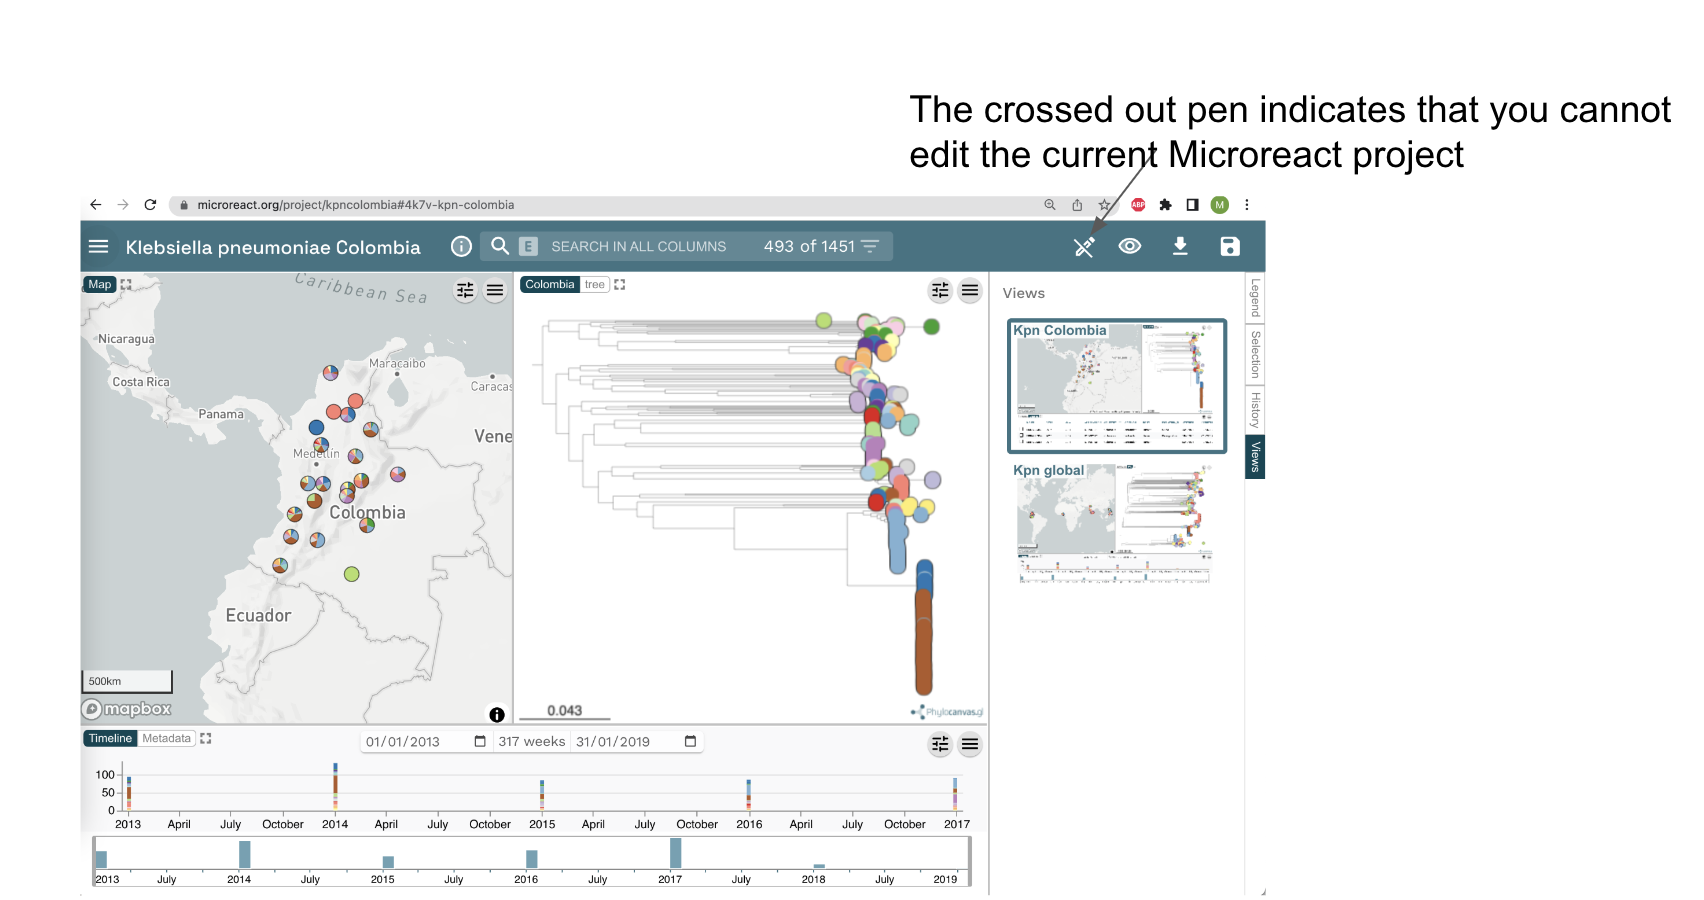
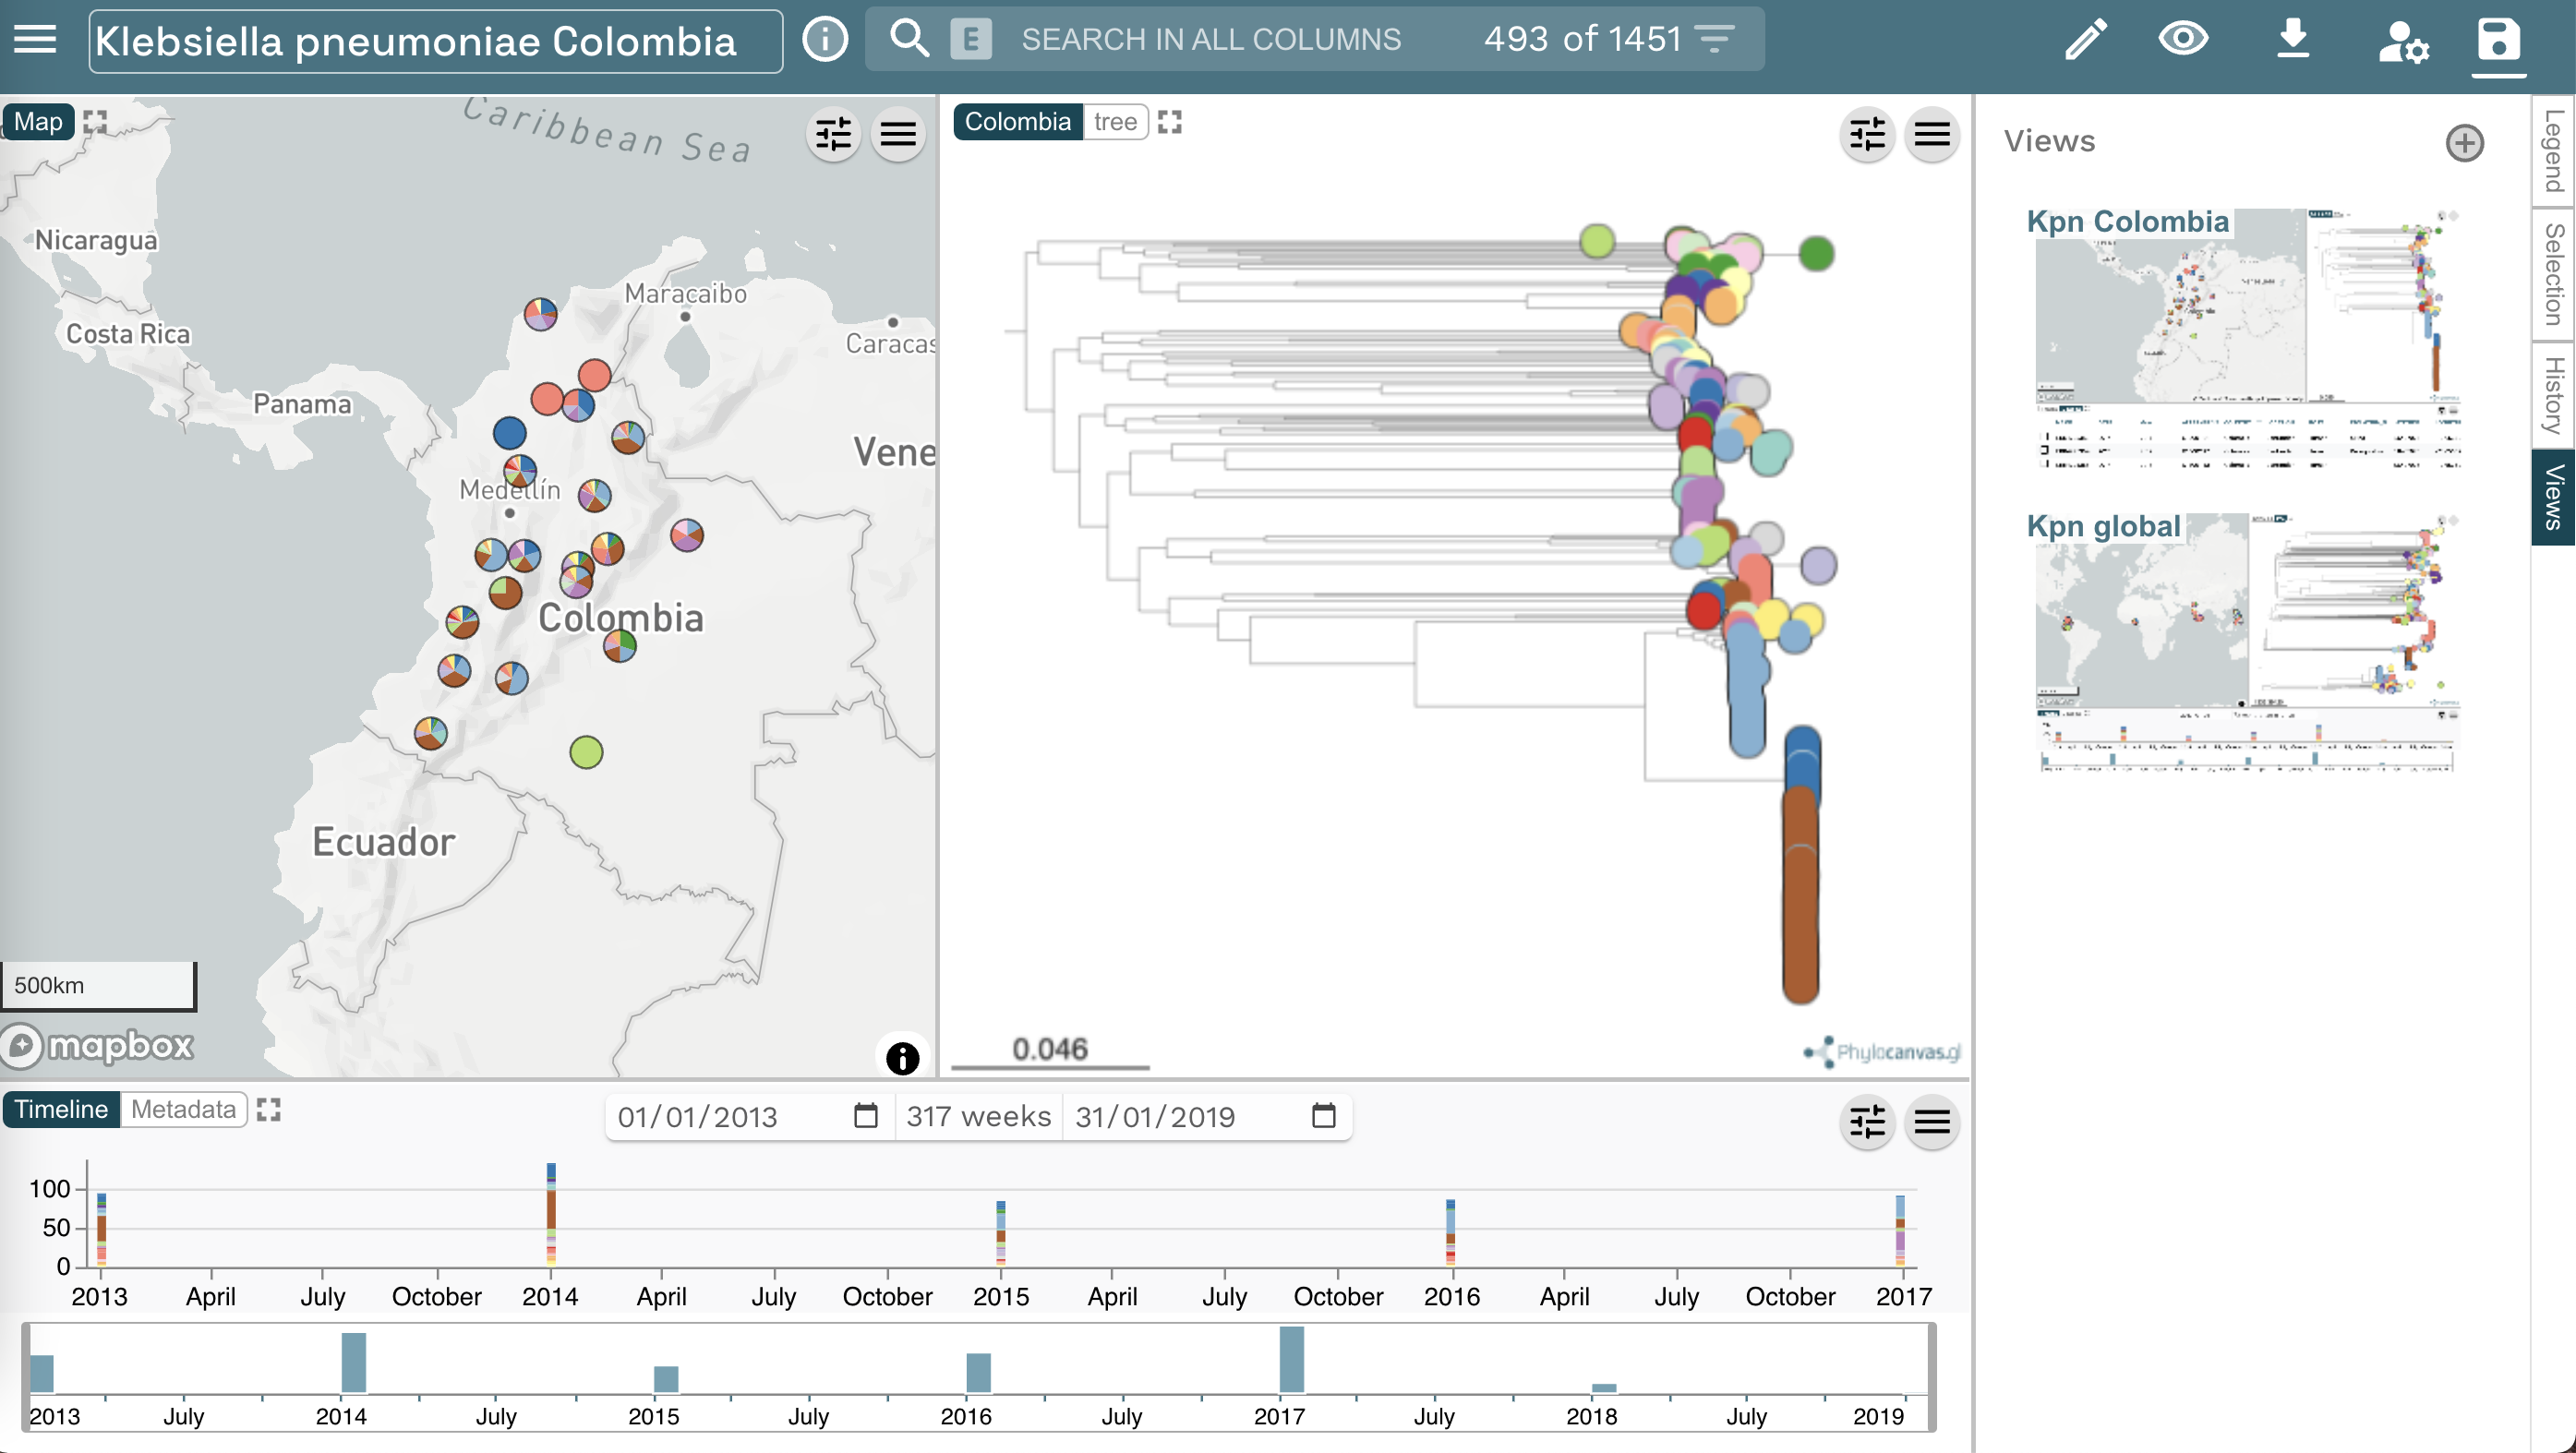
This is a screenshot of a Microreact project called “Klebsiella pneumoniae Colombia”. Notice the main panels in this project: the map, the tree, the timeline and the saved views.

Task 1: Create an editable project.

Task 1: Create an editable project. Step 1: Notice the crossed out pen on right top corner of your screen. This indicates that you cannot edit the current Microreact project.
Task 1: Create an editable project. Step 2: Click the crossed out “Pen” symbol in the top right of the screen. A window appears asking you to “SIGN IN TO EDIT”.

Task 1: Create an editable project. Step 3: Once you sign in, the message changes, and you are invited to “MAKE A COPY” of the current project. Make a copy, to proceed.

Task 1: Create an editable project. Step 4: Notice that, once you made a copy of the project, the crossed out “pen” symbol will change to a “normal pen”, and you will be able to edit and save the project.

Task 2: Present whole genome sequencing quality control (WGS QC) statistics in a chart.
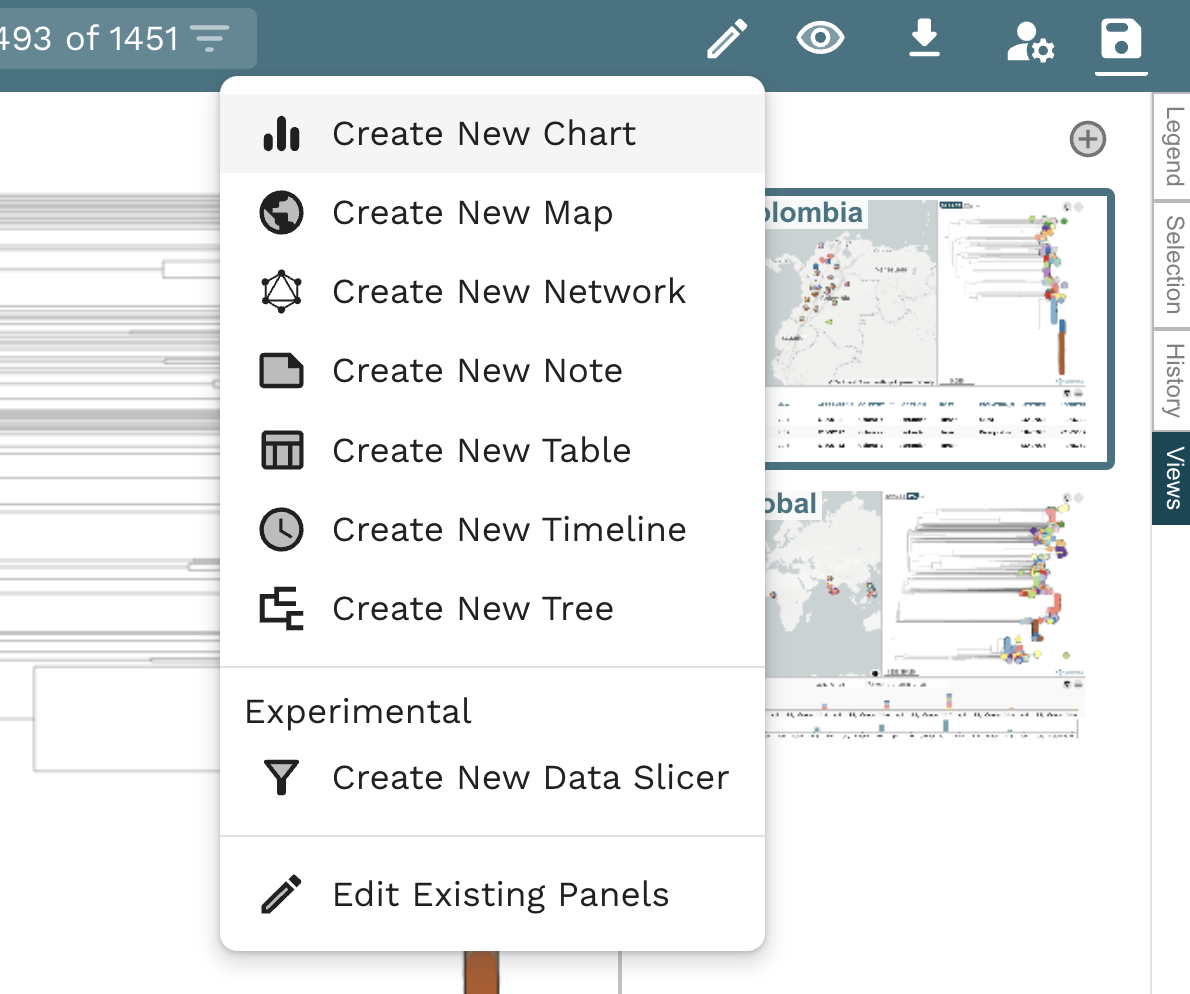
Task 2: Present WGS QC statistics in a chart. Step 1: Select the “Kpn Colombia” view. Click on the “Pen” symbol on the top right menu. Click on the “Create New Chart”

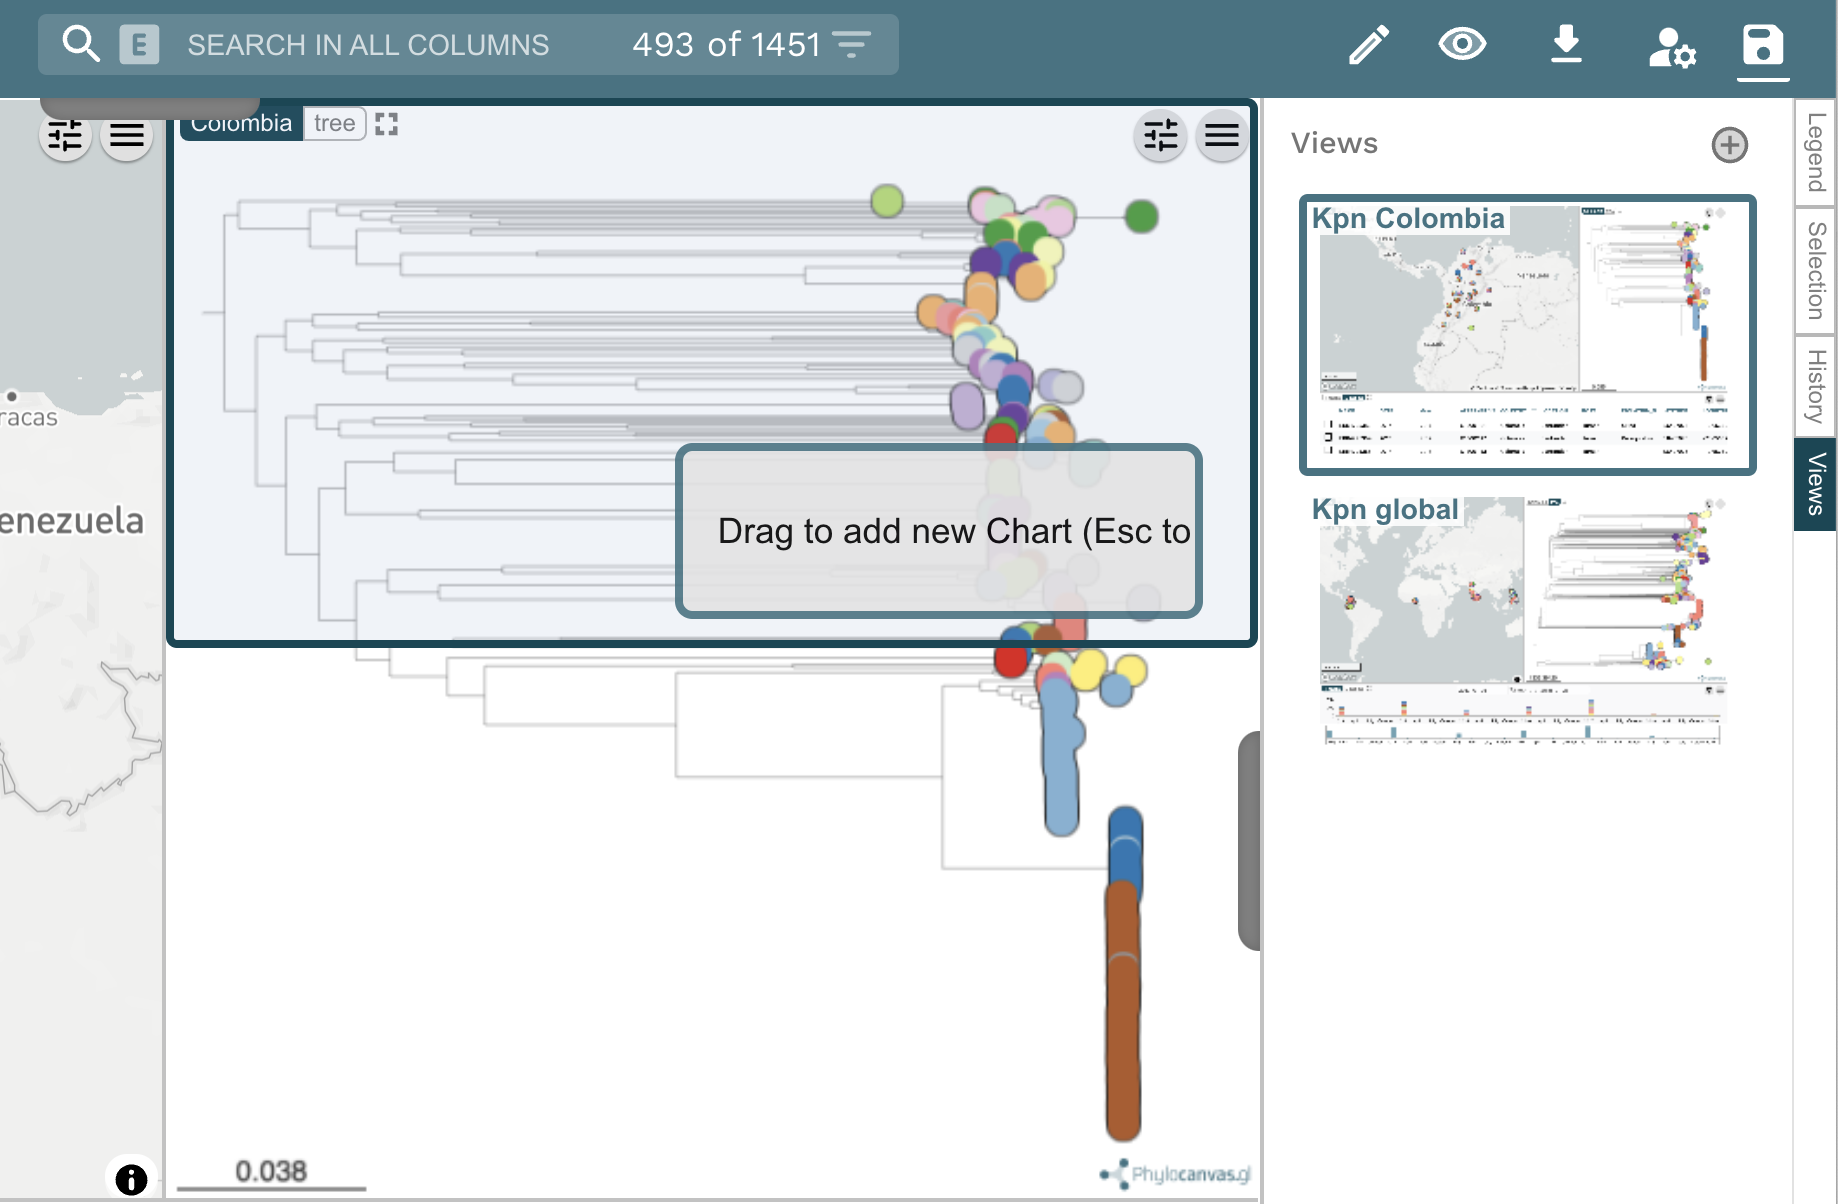
Task 2: Present WGS QC statistics in a chart. Step 2: Drag the new chart to overlap with the tree.

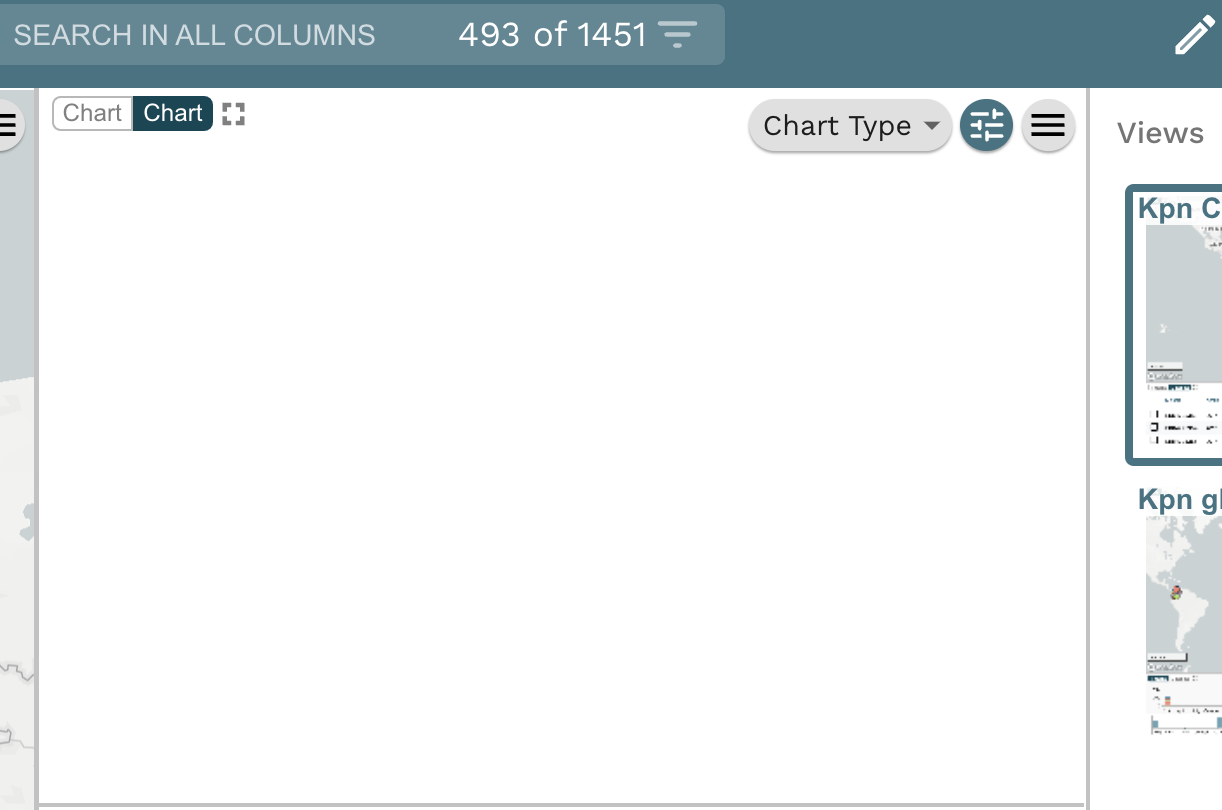
Task 2: Present WGS QC statistics in a chart. Step 3: An empty panel for the new chart will be shown on top of the tree panel.

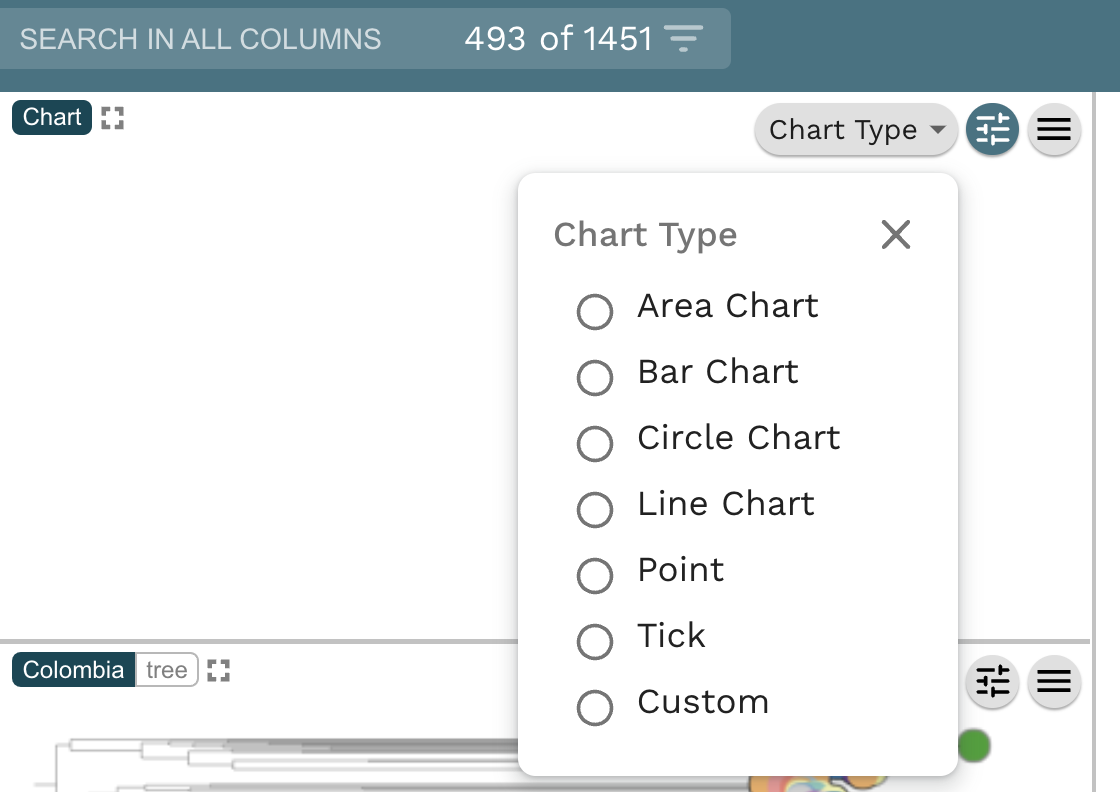
Task 2: Present WGS QC statistics in a chart. Step 4: In the Chart Type dropdown list select “Bar Chart”.

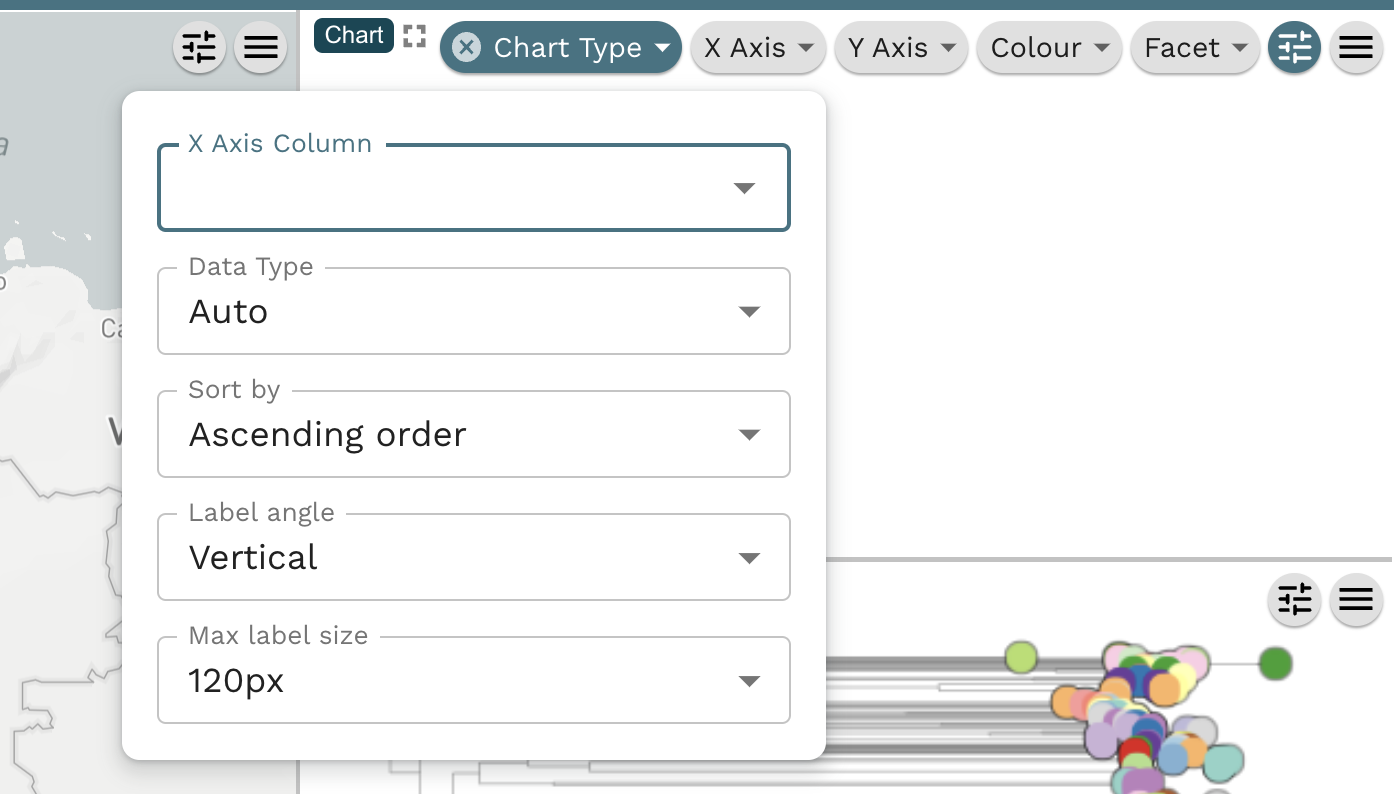
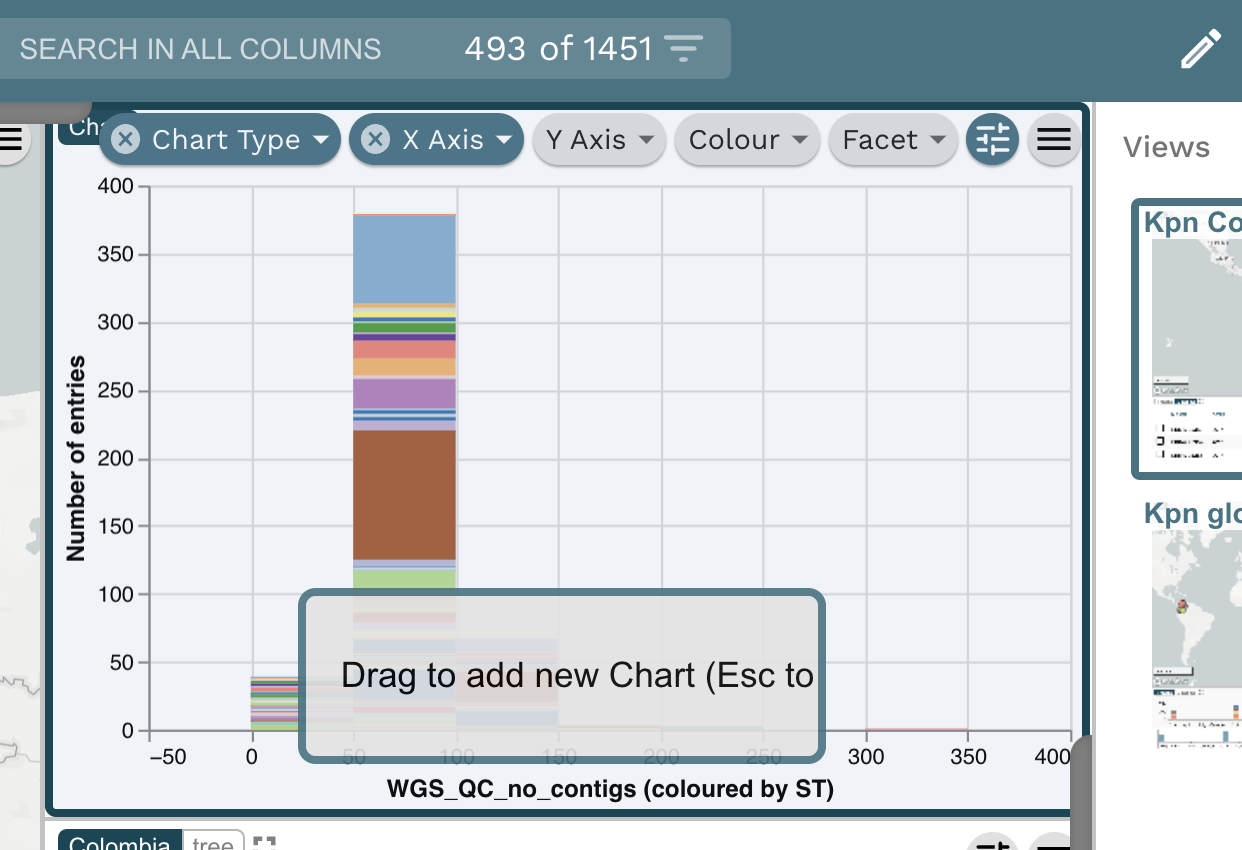
Task2: Present WGS QC statistics in a chart. Step 5: A new window appears. In the X Axis Column, select “WGS_QC_no_contigs” and for “Maximum number of bins” select 10.

Task 2: Present WGS QC statistics in a chart. Step 6: The bar chart will look like above. Observe that most genomes have less the 100 contigs.

Task 3: What are the dominating sequence types (STs) in Colombia?
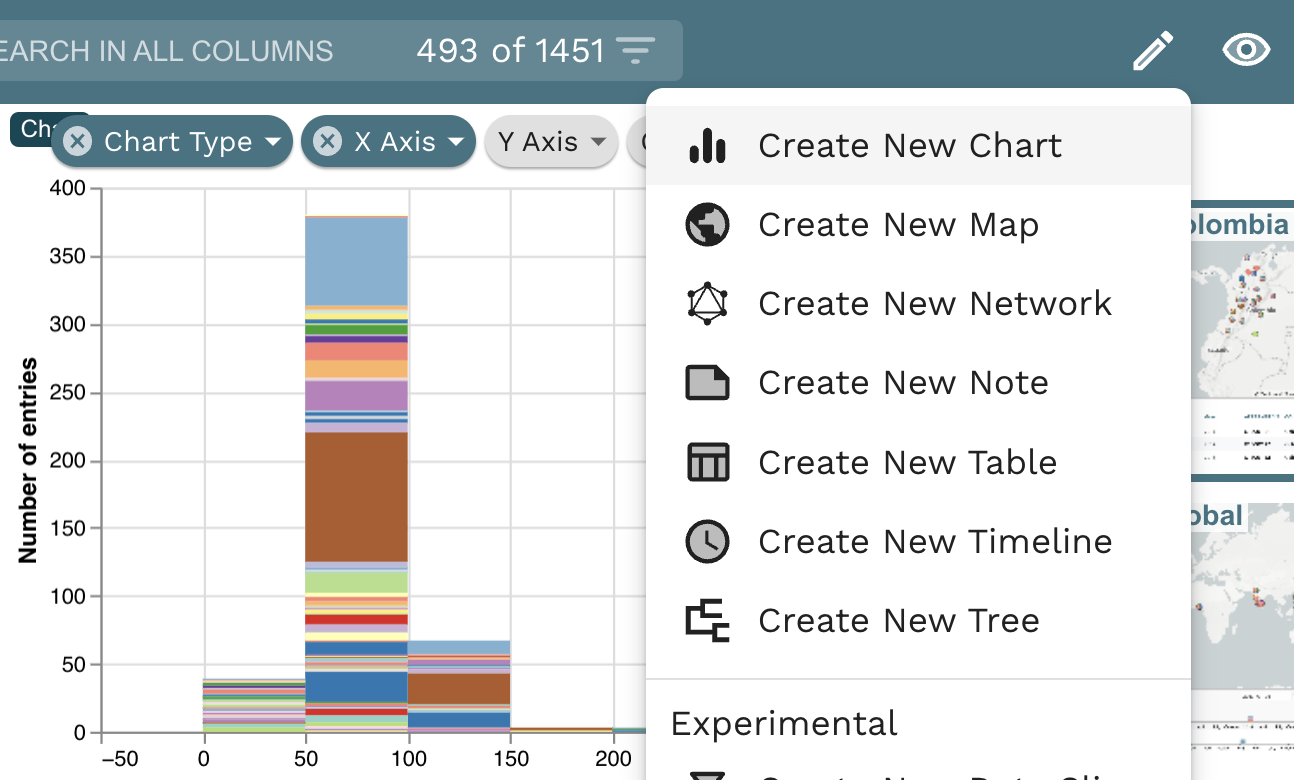
Task 3: What are the dominating STs in Colombia? Now that you’ve created one chart, you can create another one! Step 1: Go to the “Pen: symbol on the right hand side and click on the”Create New Chart”.

Task 3: What are the dominating STs in Colombia? Step 2: The new chart can stay right on top of the previously created one.

Task 3: What are the dominating STs in Colombia? Step 3: Notice a white canvas on top of the previously generated chart.

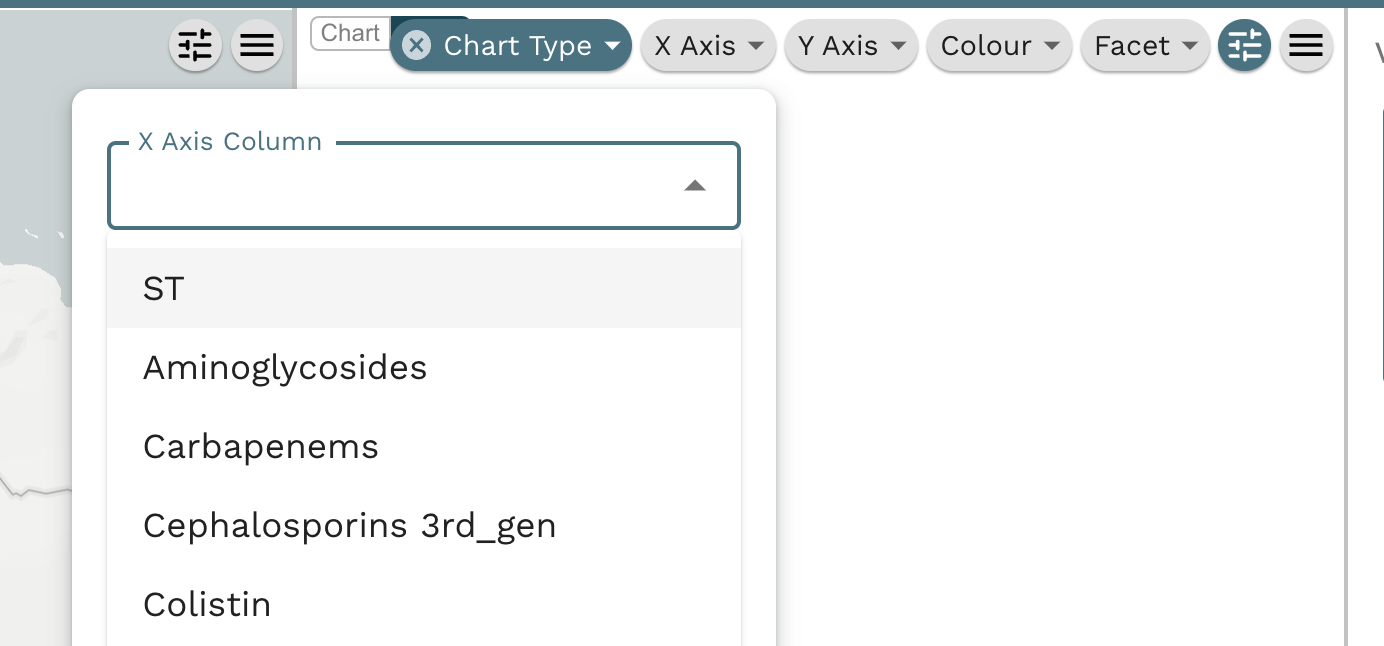
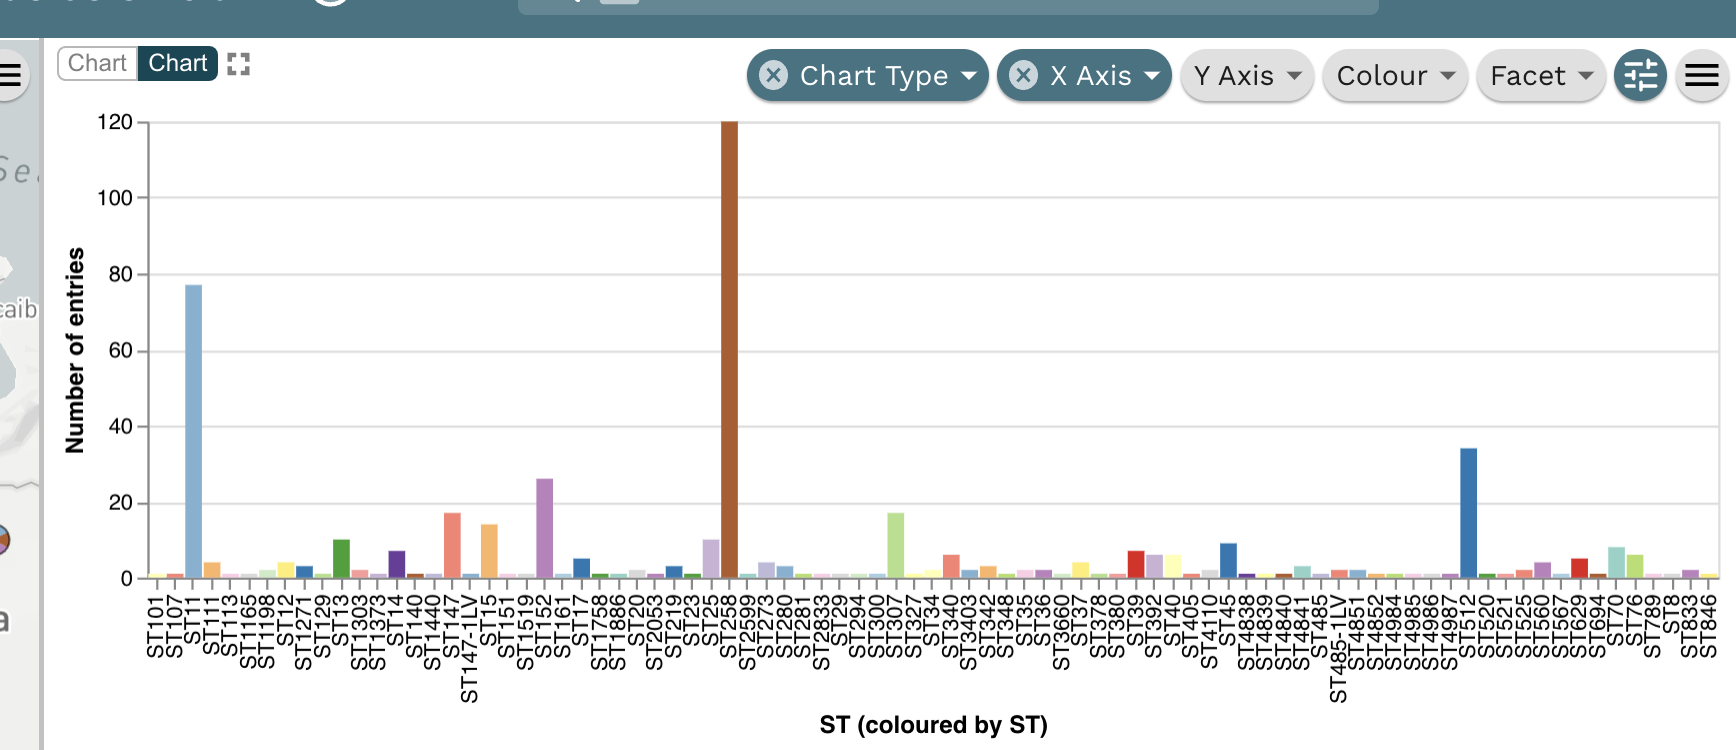
Task 3: What are the dominating STs in Colombia? Step 4: Once again, from the Chart Type dropdown menu, select “Bar Chart”, and when the new view shows up on the “X Axis Column”, select ST.

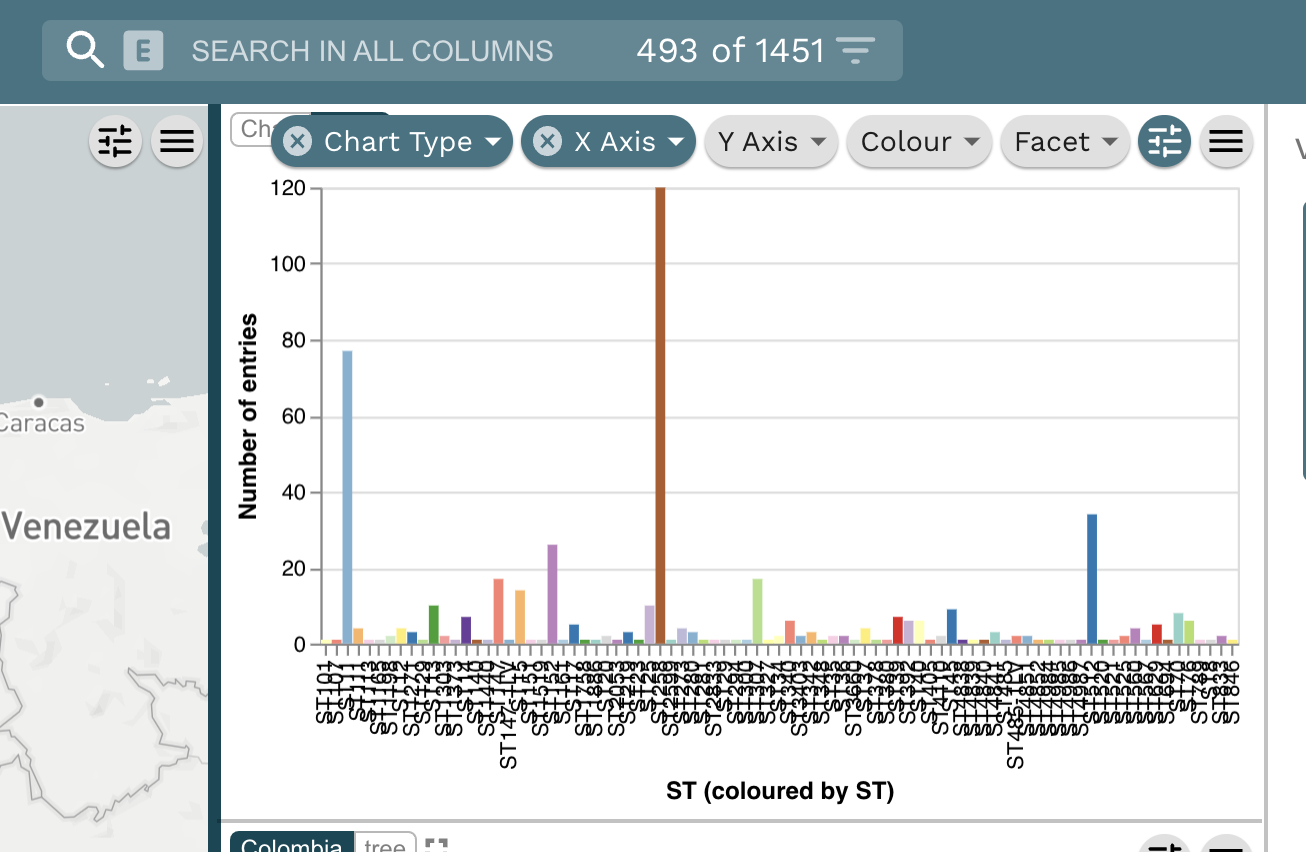
Task 3: What are the dominating STs in Colombia? Step 5: A new chart will appear. The labels on the x-axis appear squished and they are hard to read. Drag the panel divider on the left hand side of the chart, to increase the width of the panel.

Task 3: What are the dominant STs in Colombia? Step 6: The information on the x-axis should be readable now. The 3 most abundant STs are ST11, ST258 and ST512.

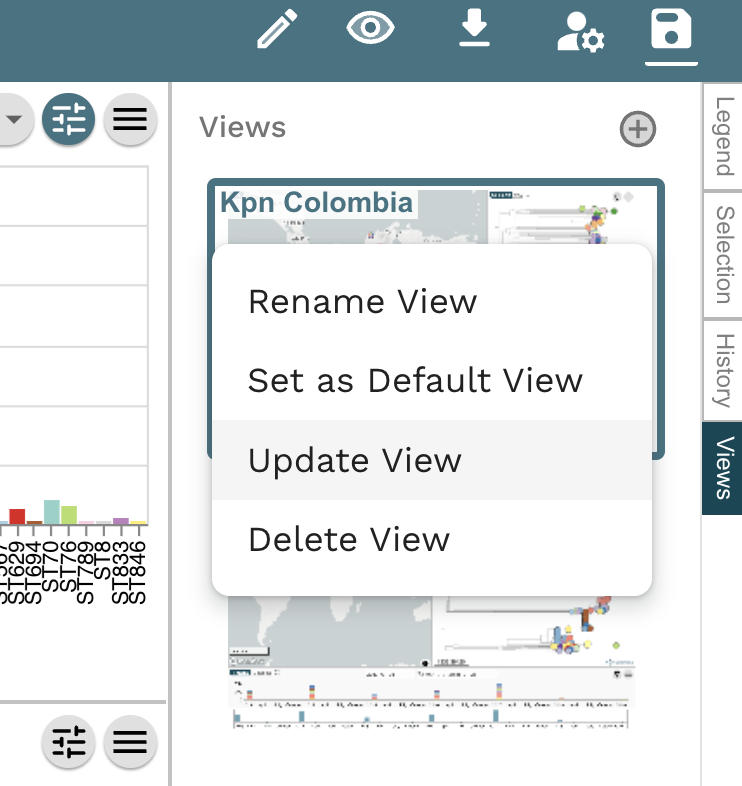
Task 3: What are the dominant STs in Colombia? Step 7: Click the “Views” panel on the left hand side, hover over “Kpn Colombia”, click on the three dots on the corner of the view and hit “Update View”

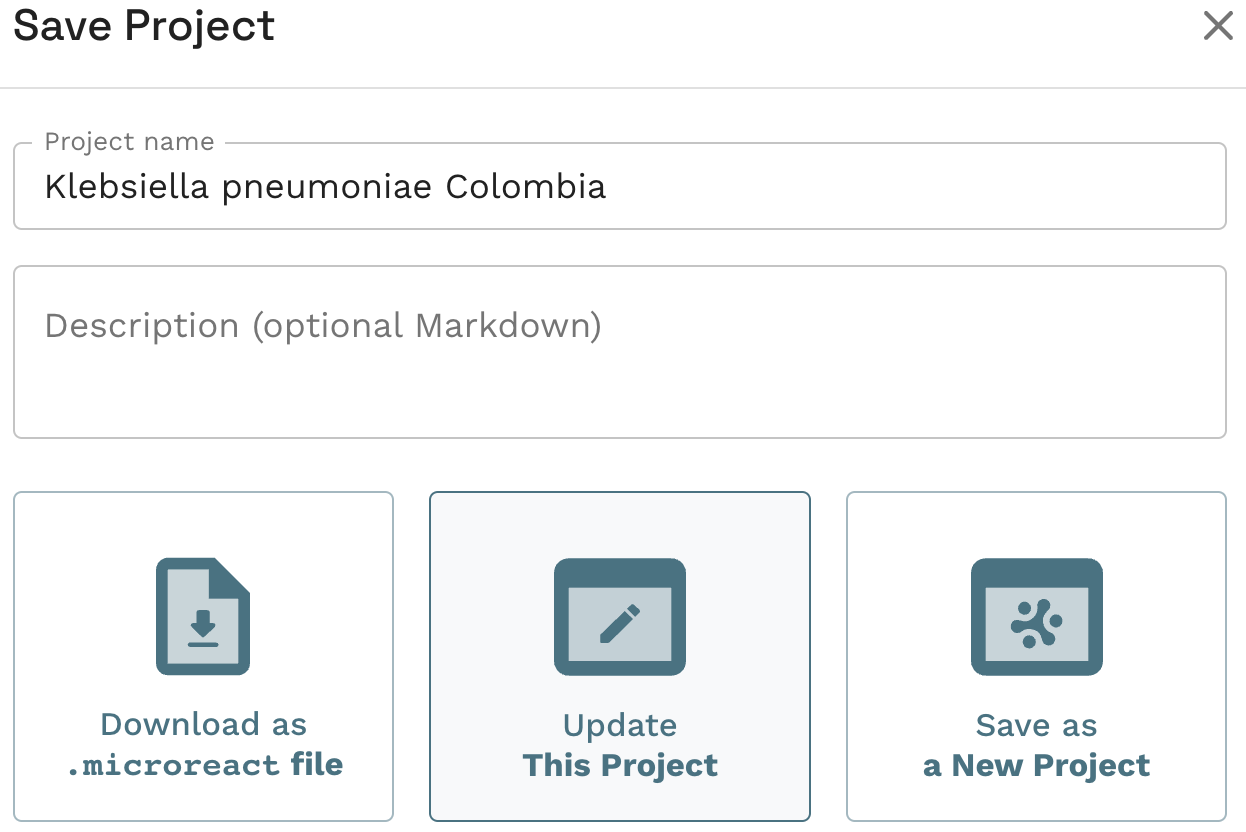
Task 3: What are the dominant STs in Colombia? Step 8: Go to the Save icon on the right corner, press the icon and choose “Update This Project”

Task 4: Plot metadata blocks for the carbapenamase genes CTX-M-15, NDM-1, KPC and OXA. What are the prevalent AMR mechanisms detected ?
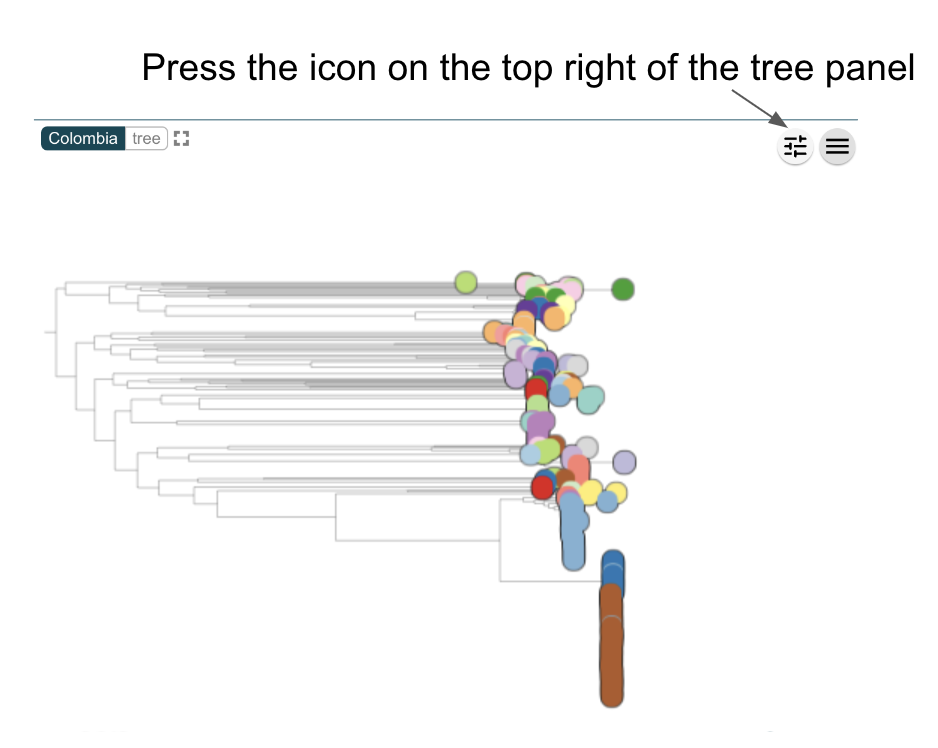
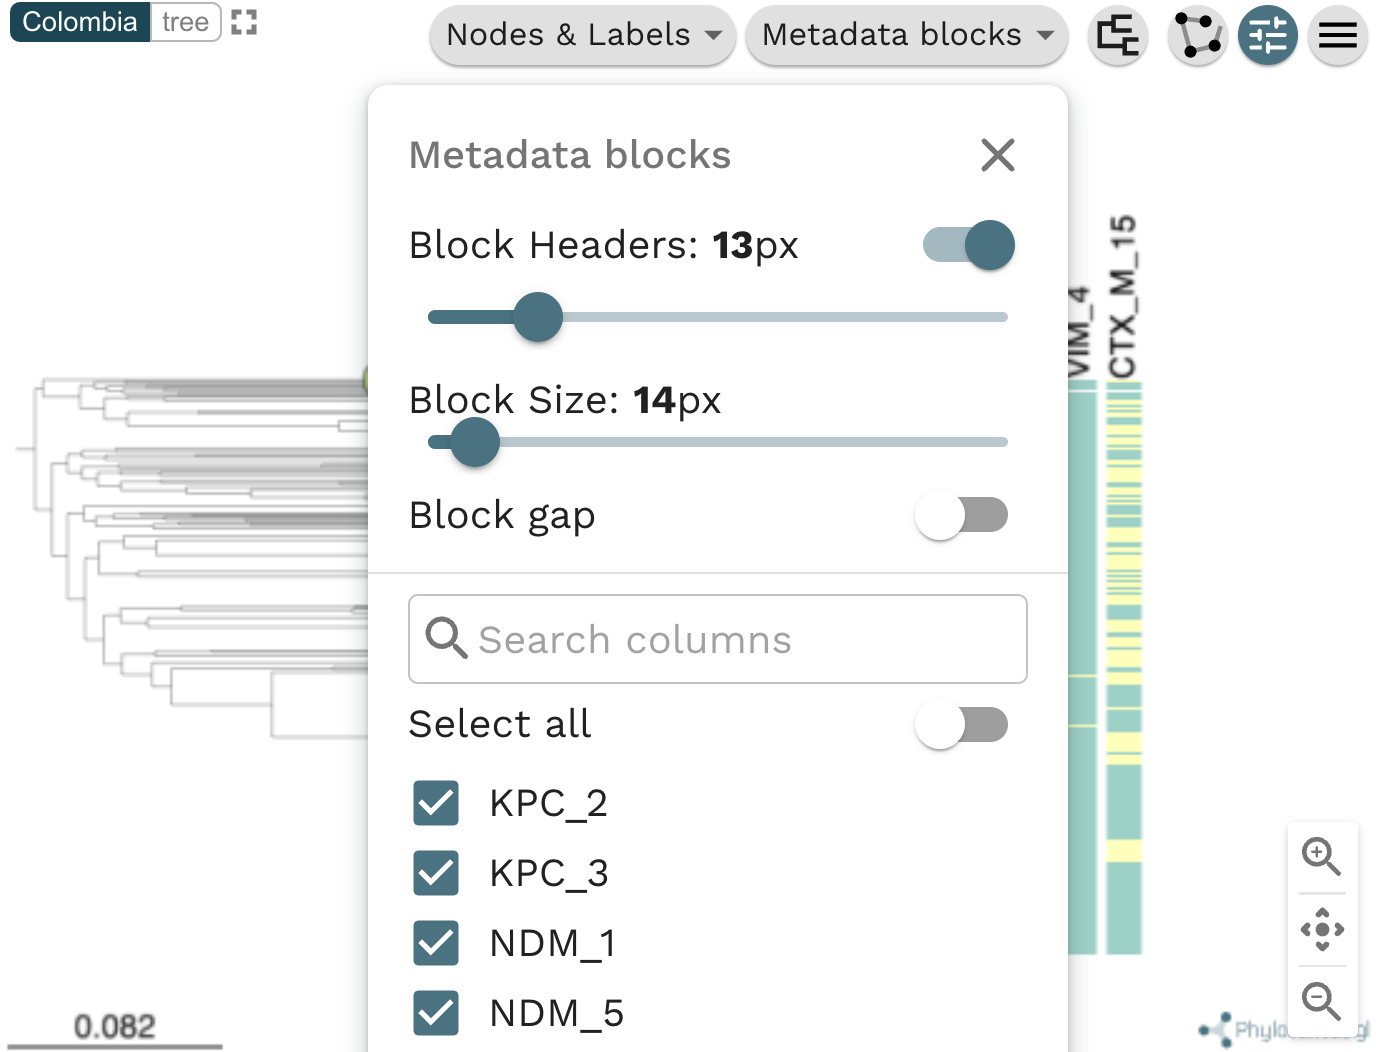
Task 4: Plot metadata blocks for CTX-M-15, NDM-1, KPC and OXA genes. What are the prevalent AMR mechanisms detected ? Step 1: Press the icon on the top right of the tree panel.
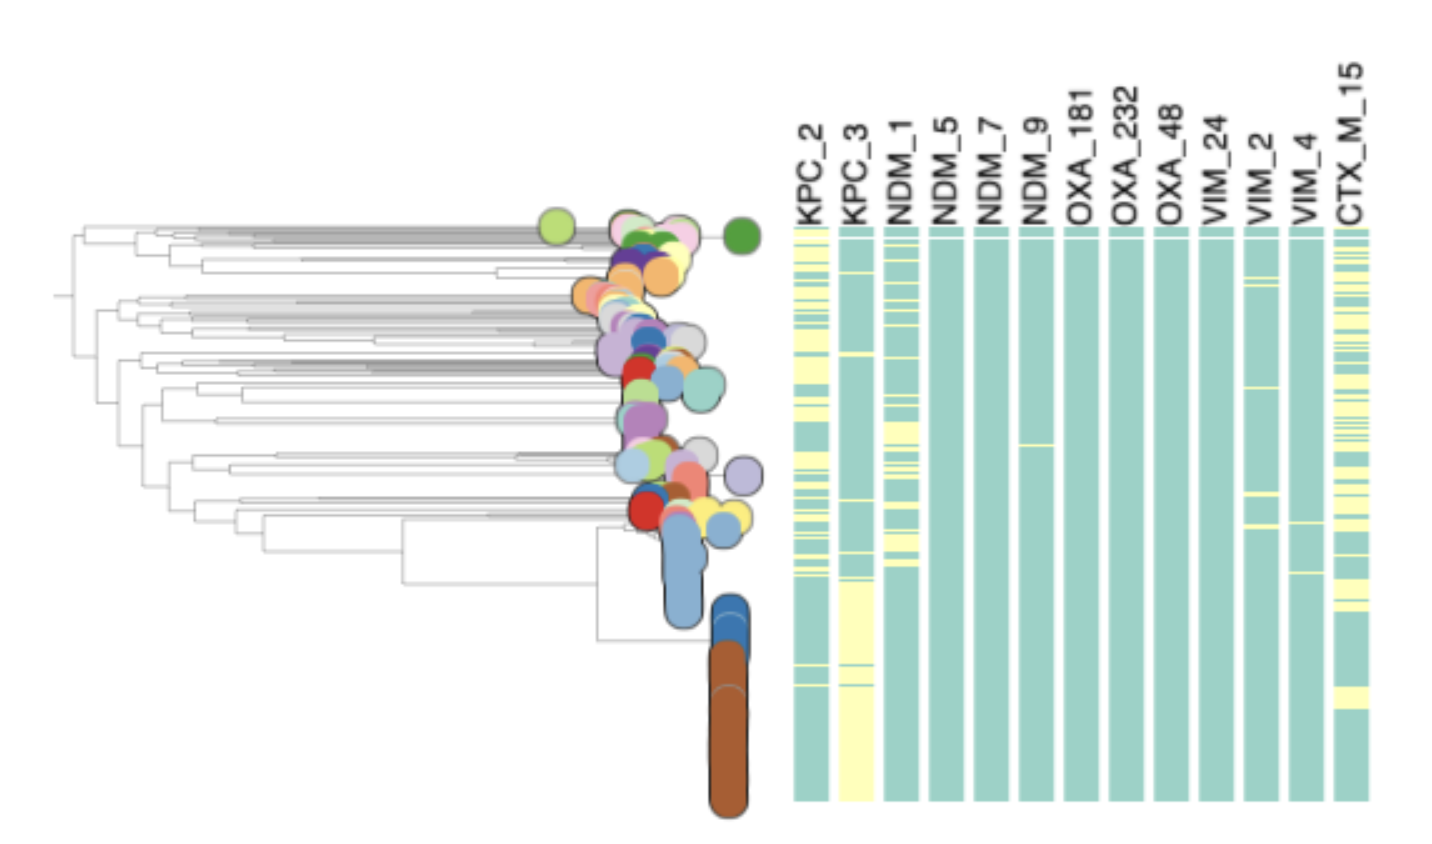
Task 4: Plot metadata blocks for CTX-M-15, NDM-1, KPC and OXA genes. What are the prevalent AMR mechanisms detected ? Step 2: In the Metadata blocks dropdown list, tick all boxes containing KPC, NDM, VIM, OXA and CTX-M-15 genes.

Task 4: Plot metadata blocks for CTX-M-15, NDM-1, KPC and OXA genes. What are the prevalent AMR mechanisms detected ? Step 3: The tree panel will show metadata columns. Yellow indicates presence of a certain gene and green indicates absence. In the panel shown here, it appears that the most common genes present are KPC-2, KPC-3, NDM-1 and CTX-M-15.

Task 5: Which STs are associated with the presence of carbapenamase genes?
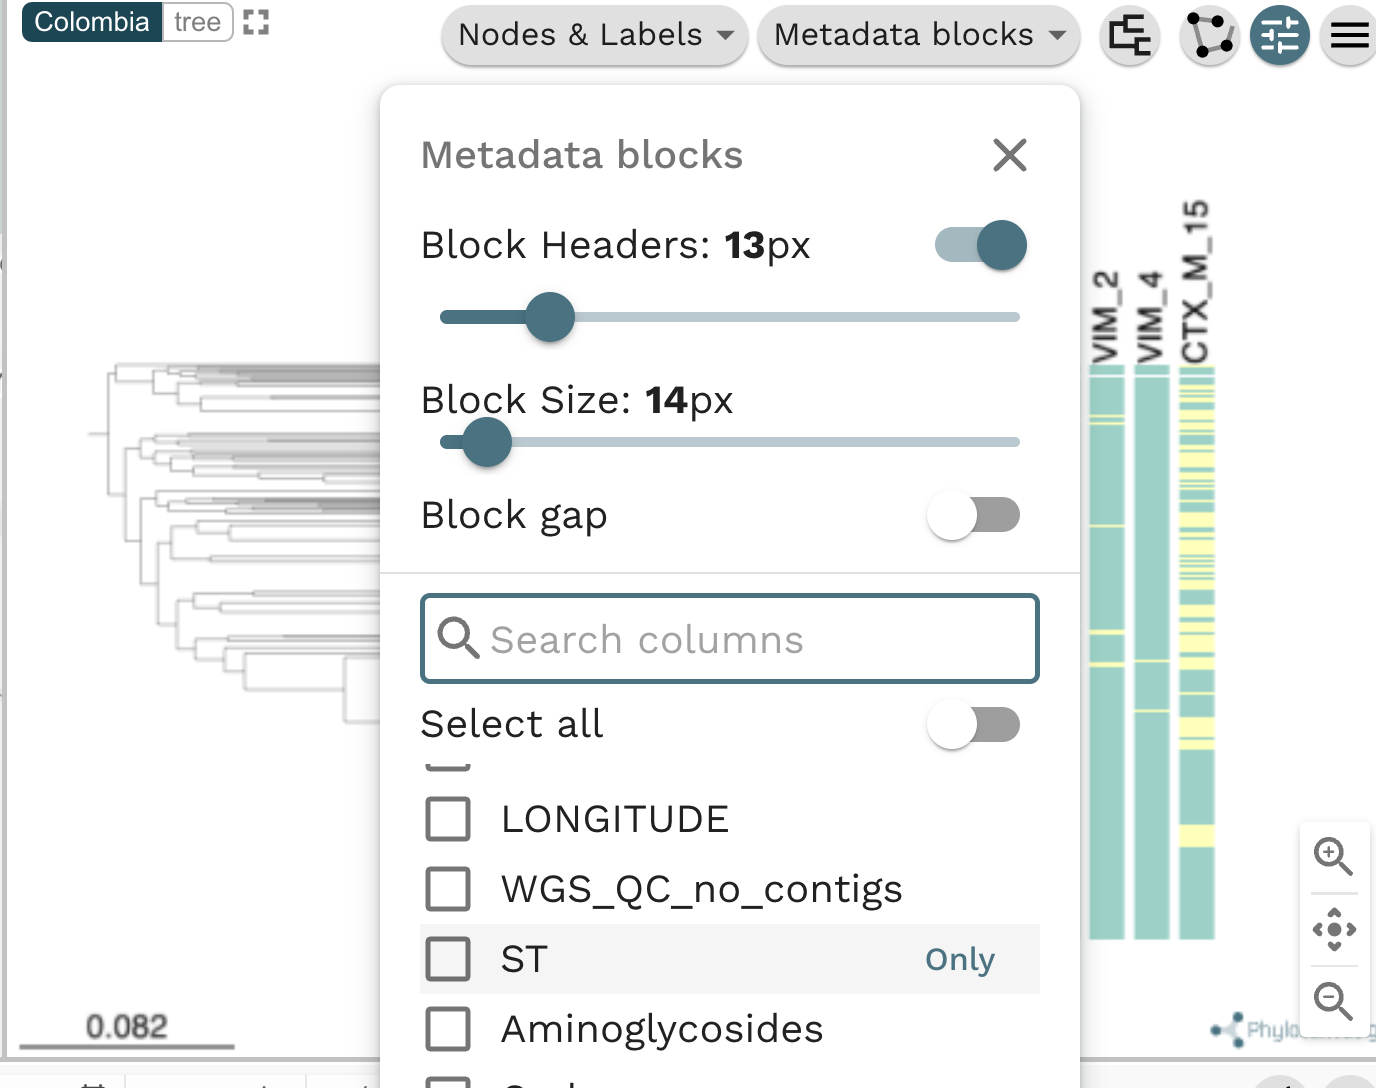
Task 5: Which STs are associated with the presence of carbapenamase genes? Step 1: Go to the “Metadata blocks” and check the ST box.
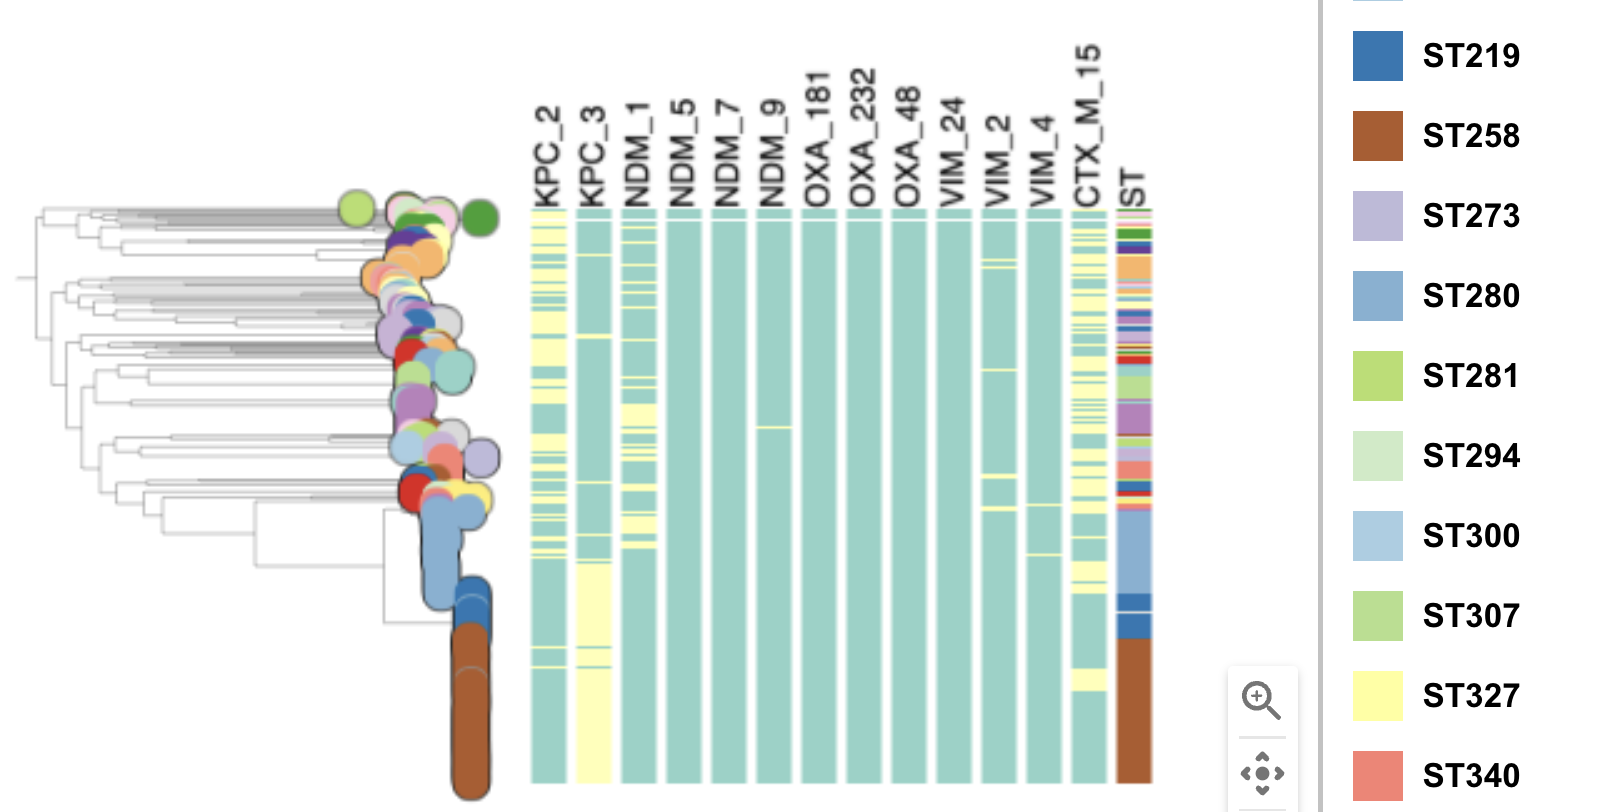
Task 5: Which STs are associated with the presence of carbapenamase genes? Step 2: Observe the new metadata column next to the tree, with the header “ST”.
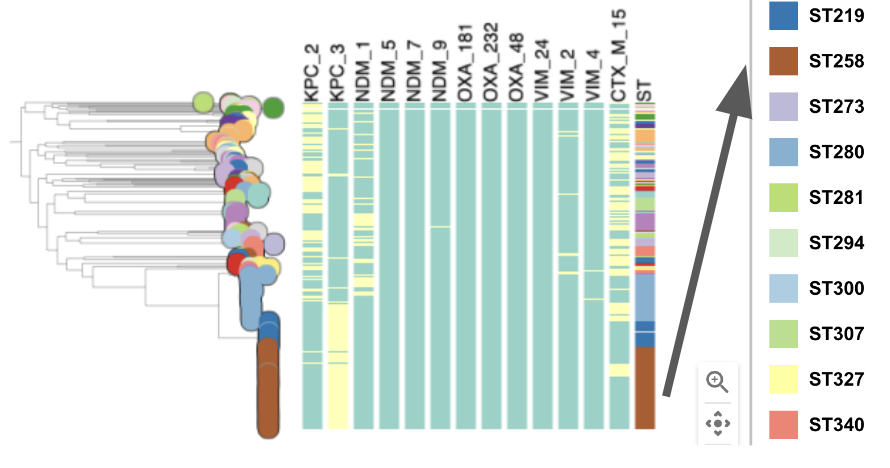
Task 5: Which STs are associated with the presence of carbapenamase genes? In the tree with added metadata blocks, we can observe a large brown block of isolates belonging to ST258. You will need to check the Legend on the very right of Microreact.
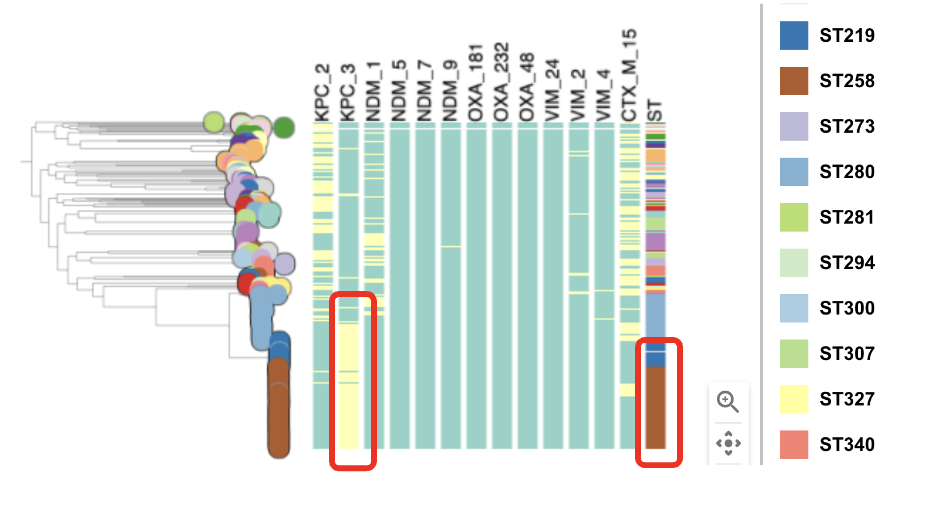
Task 5: Which STs are associated with the presence of carbapenamase genes? On a close look, we can observe that ST258 is associated with the presence of the carbapenamase gene KPC-3.